Cyclistic Case Study: Analyzing Customer Trends to Drive Membership Growth
This study leverages historical data to identify trends in bike usage between two customer segments: casual riders and annual members. The primary tools used for this analysis include Spreadsheets, SQL, and Tableau.

Introduction
As part of the capstone project for the Google Data Analytics Professional Certificate course, which I completed in April 2024, I conducted a comprehensive case study on Cyclists, a Chicago-based bike-share company. This study leverages historical data to identify trends in bike usage between two customer segments: casual riders and annual members. The primary tools used for this analysis include Spreadsheets, SQL, and Tableau.
Scenario
Cyclistic offers two types of services to its customers. Casual riders purchase single-ride or full-day passes, while members opt for annual subscriptions. Financial analyses have shown that annual members are significantly more profitable than casual riders. The Director of Marketing believes that the company’s future success hinges on increasing the number of annual memberships.
The marketing analytics team aims to understand the behavioral differences between casual riders and annual members. Insights derived from this analysis will inform a new marketing strategy designed to convert casual riders into annual members. The primary stakeholders of this project include Cyclistic’s Director of Marketing and the Cyclistic executive team, with the marketing analytics team serving as secondary stakeholders.

Defining the Problem
Ask:
The key challenge for the Director of Marketing and the marketing analytics team is developing strategies to convert Cyclistic’s casual riders into annual members. This project focuses on the first of three guiding questions:
- How do annual members and casual riders use Cyclistic bikes differently?
- Why would casual riders buy Cyclistic annual memberships?
- How can Cyclistic use digital media to influence casual riders to become members?
We can identify patterns and behavioral differences between these customer groups by examining the data. These insights will enable the creation of accurate customer profiles, facilitating high-quality, targeted marketing efforts to convert casual riders into members. For the Cyclistic executive team, these insights will help maximize the number of annual members, driving future growth for the company.

Business Task
The primary business task is to analyze historical bike trip data to uncover trends in how annual members and casual riders use Cyclistic bikes differently. This analysis will inform the development of effective marketing strategies to increase annual memberships.
Preparation
-- --PREPARATION PHASE

-- combining the data and creating new columns then a new table within a new deatabase called :"bikes"
-- create a table with combined data (rides)
-- I created a table, then I exported my query to my database.
-- combining tables
-- creating new columns then anew table called "ride"
-- I appended the table to include the following:
-- Day of the week AS day_of_week
-- Month AS month
-- Day AS day
-- Year AS year
-- ride length as ride_length
-- formatted timestamp AS time
-- Analysing phase: In this step, I analyzed the data to gain various insights,including:
-- Average ride length
-- Maximum, minimum, and mode ride length
-- Trends in riding time based on hours, days, months, and seasons. Seasonal trends

SELECT Min (ride_length)
FROM   "Cyclistic".bikes.ride r;

--checking the avg 00:30:41.061351 casual
--00:12:46.18954 member
SELECT Avg (ride_length)AS avg_ride_len,
       member_type
FROM   "Cyclistic".bikes.ride
GROUP  BY member_type;

-- checking how many stations there are  (1597 stations)
SELECT Count(DISTINCT end_station_name)
FROM   "Cyclistic".bikes.ride r;

-- confirms the station count (1351 stations )
SELECT Count(DISTINCT start_station_name)
FROM   "Cyclistic".bikes.ride r;

-- this query checks for the most popular and least popular day for casual riders
SELECT Count(month) AS count,
       month
FROM   "Cyclistic".bikes.ride r
WHERE  member_type = 'member'
       AND member_type = 'casual'
GROUP  BY "month";

-- counting the casual riders (643,125)
SELECT Count(member_type)
FROM   cte_bike_rides
WHERE  member_type = 'member';

-- minimum amount of time spent on a bike divided per group
--casual 23 mn and member 31 min
SELECT Min (ride_length) AS min_trip_time,
       member_type
FROM   cte_bike_rides
GROUP  BY member_type;

-- maximum amount of time spent on a bike divided per group
--casual 64 days 6:49:01 and member 1 days 1h00
SELECT Max (ride_length) AS min_trip_time,
       member_type
FROM   "Cyclistic".bikes.ride r
GROUP  BY member_type;

--calculate the average of casual riders 00:30:41.061351
--AND members riders 00:12:46.18954
SELECT Avg (ride_length)AS avg_trip_time,
       member_type
FROM   "Cyclistic".bikes.ride r
GROUP  BY member_type;

--  trip time (day)
-- this query checks what days are the most popular ones within the week (saturday is the most popular day)
SELECT Count(day_of_week) AS count,
       day_of_week
FROM   "Cyclistic".bikes.ride r
GROUP  BY day_of_week;

-- this query checks for the most popular and least popular day for casual riders (saturday is the most popular day and thursday is the least one)
SELECT Count(day_of_week) AS count,
       day_of_week
FROM   "Cyclistic".bikes.ride r
WHERE  member_type = 'casual'
GROUP  BY day_of_week;

-- this query checks for the most popular and least popular day for members riders saturday isthe most popular day and sunday the least one
SELECT Count(day_of_week) AS count,
       day_of_week
FROM   "Cyclistic".bikes.ride r
WHERE  member_type = 'member'
GROUP  BY day_of_week;

-- trip time (month)
-- this query selects the number of frequency of rides per month for members
SELECT Count(month) AS count,
       month
FROM   "Cyclistic".bikes.ride r
WHERE  member_type = 'member'
GROUP  BY "month";

-- this query selects the number of frequency of rides per month for casual riders
SELECT Count(month) AS count,
       month
FROM   "Cyclistic".bikes.ride r
WHERE  member_type = 'casual'
GROUP  BY month;

SELECT Count(ride_length),
       "month"
FROM   "Cyclistic".bikes.ride r
GROUP  BY "month";
-- Total Trips: Members vs Casual
-- Looking at overall, annual member and casual rider totals
--3489838 members/ 3489838 casual/ 5479259 total
Analyse : In this step, I analyzed the data to gain various insights, including:
- Average ride length
- Maximum, minimum
- Trends in riding time-based on hours, days, months, and seasons
- Seasonal trends
- Bike preference trends
These parameters were examined to understand how casual riders and annual members use the bikes.
For further information on SQL queries, You can view my GitHub repository here: https://github.com/yourusername/your-repository
Share:
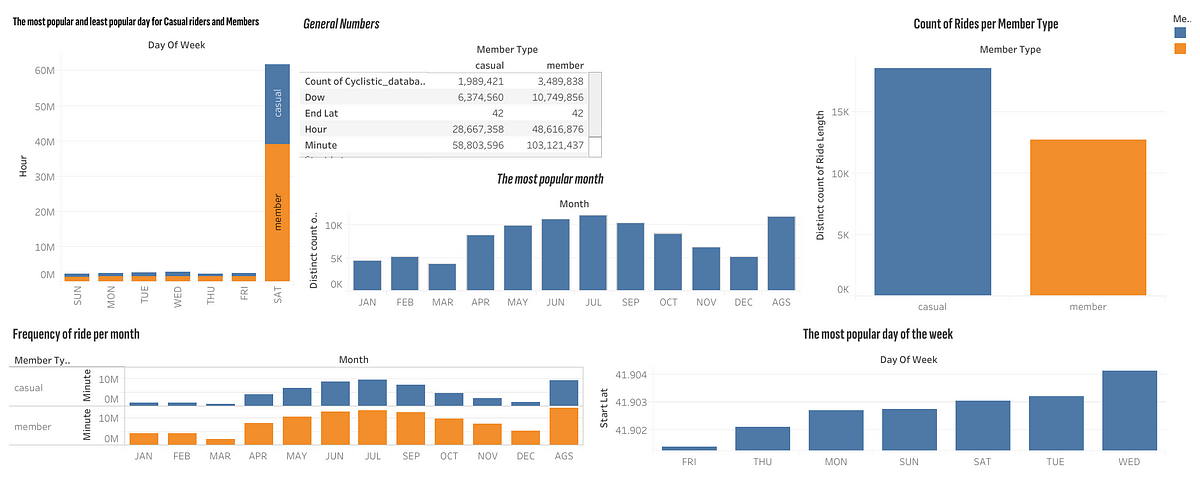
I used Tableau Public to create visualizations of the data.
The link can be found here on https://public.tableau.com/views/CyclisticFullProjectTableauPublic/Dashboard1?:language=en-US&:sid=&:display_count=n&:origin=viz_share_link

Act:
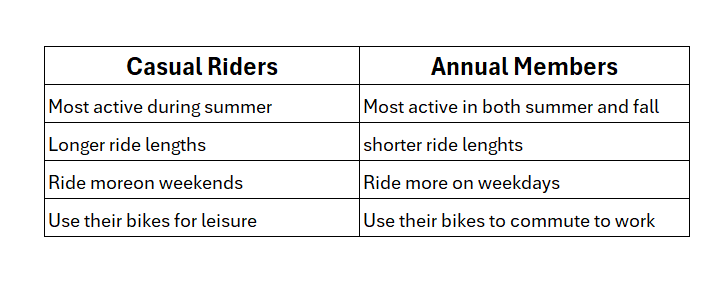
In my analysis of the Cyclistic bike share data, I discovered several key insights, summarized Like this:

While these insights are based on the available data, additional information could have further enriched the analysis:
- Member IDs to determine the number of unique customers.
- Pricing details of the current payment plans.
Recommendations
The analysis reveals distinct usage patterns between annual members and casual riders. Offering new membership options would be more effective than focusing on converting casual riders into annual members.
Top 3 Recommendations
- Introduce seasonal passes.
- Offer monthly or weekend passes.
- Launch a digital marketing campaign to promote these new membership options to casual riders.


